Augmented Reality (AR) is confidently at the precipice of mass market ubiquity. This has been an expected outcome for years, but barriers in price, hardware and software maturity, ease of use, and, ultimately, end-user value have held it back. However, in today's augmented reality market, more activity and tangible products are in place than ever before, and from established names. To provide you with a better understanding of this growing market, we’ve compiled 7 augmented reality charts to tell the story of these immersive technologies.
These charts break down some of the following forecasts:
- Smart glasses shipments
- Regional outlooks
- Total revenue for augmented reality products
- Most significant enterprise segments
To start, let’s take a look at augmented reality shipment charts.
Augmented Reality Charts for Shipments
ABI Research forecasts that 46.9 million augmented reality smart glasses will ship in 2027. That’s up from 1.4 million shipments in 2022 and a Compound Annual Growth Rate (CAGR) of an incredible 102.4% during the forecast period.
Chart 1: Augmented Reality Smart Glasses Shipments by Form Factor
World Markets: 2015 to 2027
(Source: ABI Research)
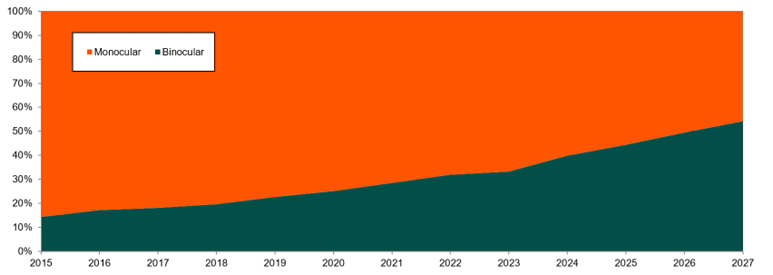
As pointed out in Chart 1, while more than twice as many augmented reality smart glasses shipped in 2022 were monocular, by 2027, there will be about 4 million more smart glasses shipments in the binocular form factor than monocular.
Chart 2: Augmented Reality Shipments by Region
World Markets: 2015 to 2027
(Source: ABI Research)
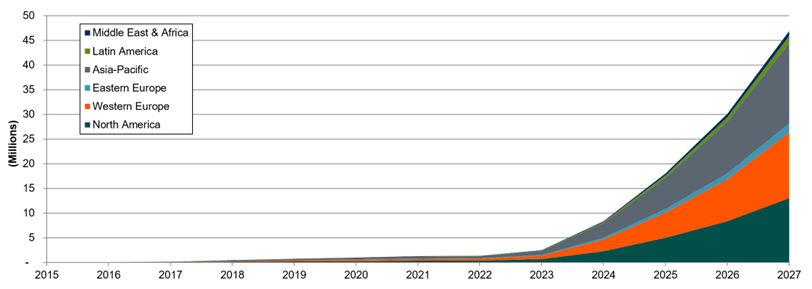
When it comes to regional outlook, North America and Western Europe will be nearly dead even through 2027. By that time, each region will experience more than 13 million annual shipments of augmented reality devices.
Meanwhile, Asia-Pacific, given its enormous population, will lead the pack in terms of augmented reality shipments. Compared to 492,000 shipments in 2022, that number will explode to 16.2 million shipments in 2027.
Chart 3: Augmented Reality Smart Glasses Hardware Shipments: Consumer versus Enterprise Segments
World Markets: 2015 to 2027
(Source: ABI Research)
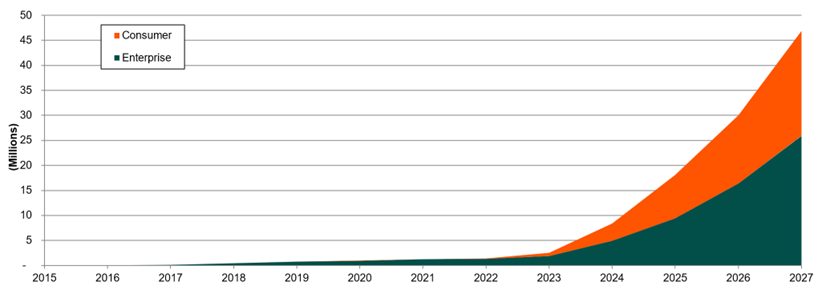
As you can see in Chart 3, the enterprise segment dominates the augmented reality market, accounting for 94% of total shipments in 2022. However, the consumer segment will nearly catch up entirely with the enterprise segment by 2027 when the former will account for 45% of the 46.9 million smart glasses shipped that year. A primary factor in this growth stems from the decreasing Average Selling Prices (ASPs) for smart glasses.
Augmented Reality Charts for Revenue
In this section, we dive into the market data for augmented reality revenue—across regions, value chain categories, and industries.
Chart 4: Augmented Reality Smart Glasses Hardware Revenue by Region
World Markets: 2015 to 2027
(Source: ABI Research)
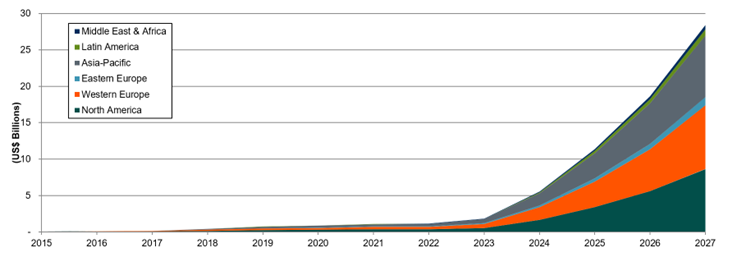
As seen in Chart 4, augmented reality hardware sales are growing at a CAGR of 91% between 2022 and 2027—reaching US$28.4 billion by 2027. North America, Western Europe, and Asia-Pacific will generate similar revenue of around US$8.5 billion each in 2027.
Chart 5: Total Augmented Reality Market Revenue by Region
World Markets: 2015 to 2027
(Source: ABI Research)
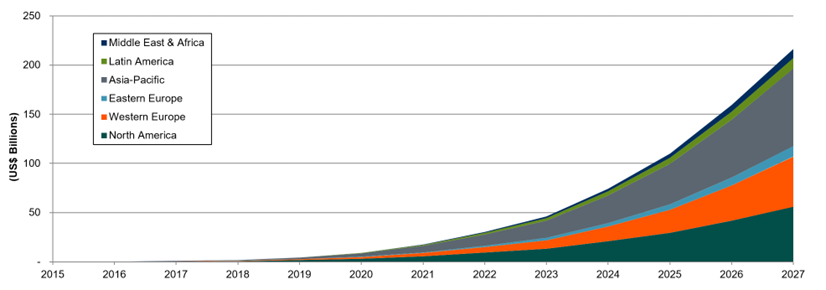
Chart 5 shows how the augmented reality value chain is distributed throughout the world, coming to a total value of US$216.4 billion by 2027. As you can see, Asia-Pacific comes out on top, with US$78.6 billion in revenue expected in 2027. Trailing behind are North America and Western Europe, generating US$55.9 billion and US$50.9 billion, respectively, in augmented reality revenue by the end of the forecast period.
To get a broader understanding of the entire augmented reality business opportunity, we took a look at the totality of the augmented reality value chain.
What does that mean?
The augmented reality value chain refers to revenue stemming from the following categories:
- Smart glasses hardware sales
- Enterprise software and content
- Consumer software and content
- Non-smart glasses hardware (e.g., digital signage, projectors)
- AR advertising
- Platforms and licensing
- Connectivity
- Systems integration
- Internal Information Technology (IT) spending
- Other
Chart 6: Total Augmented Reality Market Revenue by Category
World Markets: 2015 to 2027
(Source: ABI Research)
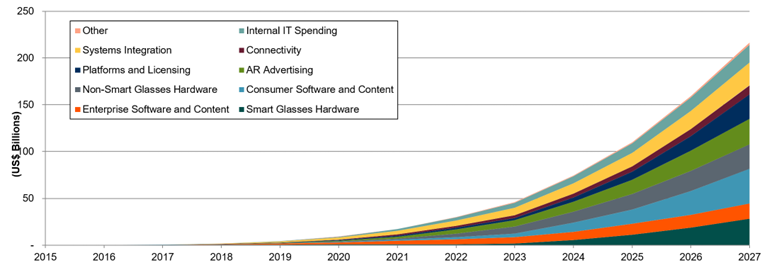
As Chart 6 shows, in total, consumer content and software generate the most revenue (US$37 billion annually by 2027). After the consumer segment, the next five largest augmented reality value chain segments are:
- Smart glasses hardware: US$28.4 billion
- Augmented reality advertising: US$27.2 billion
- Non-smart glasses hardware: US$26.2 billion
- Platforms and licensing: US$26.1 billion
- Systems integration: US$24.4 billion
Now, we identify the most promising industries for augmented reality market players.
Chart 7: Total Augmented Reality Market Revenue by Vertical
World Markets: 2015 to 2027
(Source: ABI Research)
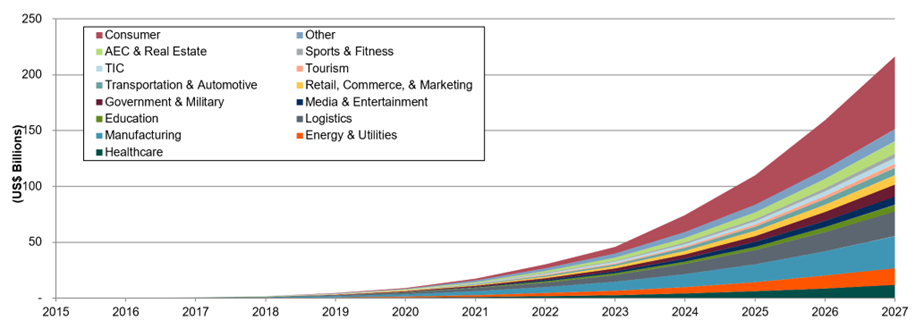
Our market forecasts pinpoint manufacturing and logistics to be the two most significant non-consumer segments for augmented reality—with US$28.6 billion and US$22.3 billion in revenue opportunities, respectively, in 2027.
Other notable industries with strong potential for augmented reality revenue include energy & utilities, healthcare, Architecture, Engineering, and Construction (AEC) & real estate, government & military, retail/commerce/marketing, media & entertainment, and transportation & automotive.
What Story Do These Charts Tell Us about the Augmented Reality Market?
As these charts exemplify, augmented reality smart glasses vendors remain mostly focused on the enterprise space, although the next 2 to 3 years will see an influx of compelling consumer devices as well. Enterprise vendors and augmented reality products like the Microsoft HoloLens 2, Lenovo ThinkReality A6 and A3, Vuzix M400, and RealWear HMT-1 and Navigator create a narrow, but highly capable smart glasses space to deliver on promising Return on Investment (ROI) in use cases like remote assistance, training, and knowledge capture.
Consumer offerings, or at least lower-cost devices that could theoretically be used for consumer applications, from these players are likely in the coming years. Meta, Apple, Google, Samsung, Snap, Huawei, and more are investing in consumer smart glasses and AR content, with products hitting the market anywhere from 2023 through the next 5 years.
Get access to exclusive, data-rich quantitative research for all of the transformational technologies we cover when you sign up for our Data Access package.

